OpenTelemetry and New Relic represent two distinct approaches to observability. OpenTelemetry is an open-source framework for collecting and standardizing telemetry data, while New Relic is a commercial observability platform that provides end-to-end monitoring capabilities.
The key distinction lies in their roles: OpenTelemetry focuses on data collection and standardization, requiring integration with backend systems (like Prometheus, Jaeger, or even New Relic) for storage and analysis. New Relic, in contrast, offers a complete solution with built-in capabilities for data collection, storage, analysis, and visualization.
This comparison explores how these tools complement each other and can work together in your observability strategy, helping you understand their strengths and use cases.
What is OpenTelemetry and New Relic?
OpenTelemetry is an open-source observability framework that standardizes telemetry data collection and export. It provides a unified set of APIs, libraries, agents, and instrumentation to capture distributed traces, metrics, and logs from your applications and infrastructure. A key advantage of OpenTelemetry is its vendor-neutral approach - it fosters interoperability between different observability tools, reducing vendor lock-in and enhancing your overall observability strategy.
OpenTelemetry Key Features
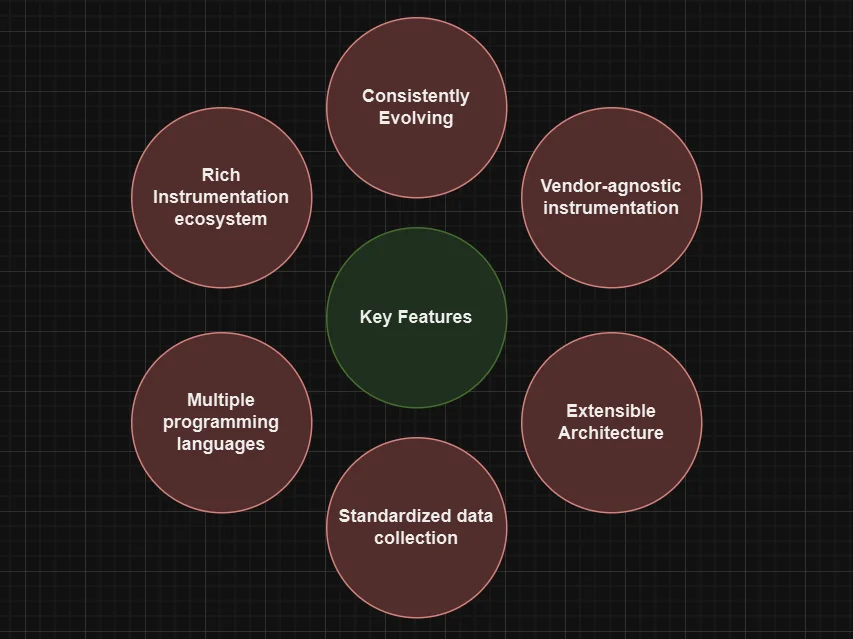
- Vendor-agnostic instrumentation: An open standard that ensures flexibility and avoids vendor lock-in
- Multi-language support: Unified toolkit for seamless instrumentation across different programming languages
- Extensible architecture: Flexible design allowing custom integrations and configurations
- Standardized data collection: Unified approach for collecting traces, metrics, and logs
- Rich instrumentation ecosystem: Extensive catalog of community-contributed instrumentation libraries
- Active development: Continuously evolving with new features and improvements while maintaining stability
New Relic takes a different approach as a commercial observability platform. It provides a comprehensive suite of monitoring and performance management tools, including Application Performance Monitoring (APM), infrastructure monitoring, log management, and other observability features in a unified platform. New Relic employs lightweight agents embedded within your applications and servers to collect performance metrics through direct code instrumentation. Each monitoring function (application, infrastructure, browser, etc.) uses a dedicated agent to gather data, which is then aggregated and displayed on centralized dashboards. This setup enables users to quickly identify and resolve performance issues across their entire stack.
New Relics Key Features
- Real-time APM with code-level visibility: New Relic APM agents provide in-depth diagnostics and profiling, including error stack traces, messages, and code locations.
- Infrastructure monitoring: New Relic Health Map connects applications to infrastructure hosts, enabling monitoring of cloud services with pre-configured dashboards and alerts.
- Log management and analysis: Centralizes logs from multiple sources with powerful querying and correlation with APM metrics.
- AI-powered anomaly detection: Uses machine learning to identify critical performance issues before they impact customers.
Can They Be Used Together?
Yes, OpenTelemetry can complement New Relic by:
- Instrumentation: Using OpenTelemetry for collecting telemetry data.
- Export: Sending OpenTelemetry data to New Relic for advanced analytics and visualization.
This approach offers the flexibility of OpenTelemetry with the powerful insights of New Relic.
The Evolution of Observability Tools
As software systems grew more complex, observability tools evolved beyond basic metrics and logs to meet new challenges:
New Relic emerged in 2008 as an APM solution for monitoring web applications. It later expanded into a comprehensive observability platform with features like distributed tracing and cloud monitoring.
OpenTelemetry arose from merging OpenCensus and OpenTracing to create a vendor-neutral standard for instrumentation. This open standard has encouraged commercial vendors to improve interoperability, giving users more flexibility and reducing lock-in.
OpenTelemetry vs. New Relic: Core Differences
The fundamental distinction between OpenTelemetry and New Relic lies in their approaches to data collection and analysis:
| Core Differences | OpenTelemetry | New Relic |
|---|---|---|
| Type | Open-source framework | Proprietary SaaS platform |
| Data Collection Methods | It uses a vendor-agnostic approach, allowing you to instrument your code once and send data to multiple backends. | It relies on proprietary agents and SDKs, optimized for its platform but potentially limiting portability. |
| Customization and Flexibility | It offers high extensibility, enabling you to create custom exporters and integrations. | It provides out-of-the-box solutions with less flexibility but faster time-to-value. |
| Pricing Models | It's open-source and free to use but requires infrastructure for data storage and visualization. | It offers a commercial licensing model with various tiers based on data ingestion and retention. |
| Community Support and Ecosystem | It benefits from a large, collaborative open-source community. | It provides enterprise-grade support and a curated marketplace of integrations. |
| Advanced Analytics | Depends on backend integration | Built-in with AI-powered insights |
Integration and Compatibility
Before OpenTelemetry (OTEL) came along, tools like New Relic relied on their own proprietary agents to gather telemetry data. These agents were specifically tailored to instrument certain libraries and send that data back to their respective systems. While New Relic's native agents still do their job, OTEL offers a lot more flexibility. For instance, it shines in situations involving managed services or SaaS endpoints where proprietary agents might not cut it. With OTEL, you can easily switch between different telemetry storage providers without having to redo all your instrumentation.
When you integrate OpenTelemetry with New Relic, OpenTelemetry provides a standardized way to collect telemetry data, while New Relic offers a robust platform to analyze and derive insights from that data, giving you a complete view of your software stack.
New Relic has recognized the growing importance of OpenTelemetry and now supports data ingestion from OpenTelemetry-instrumented applications. This integration allows you to:
Send OpenTelemetry traces and metrics to New Relic:
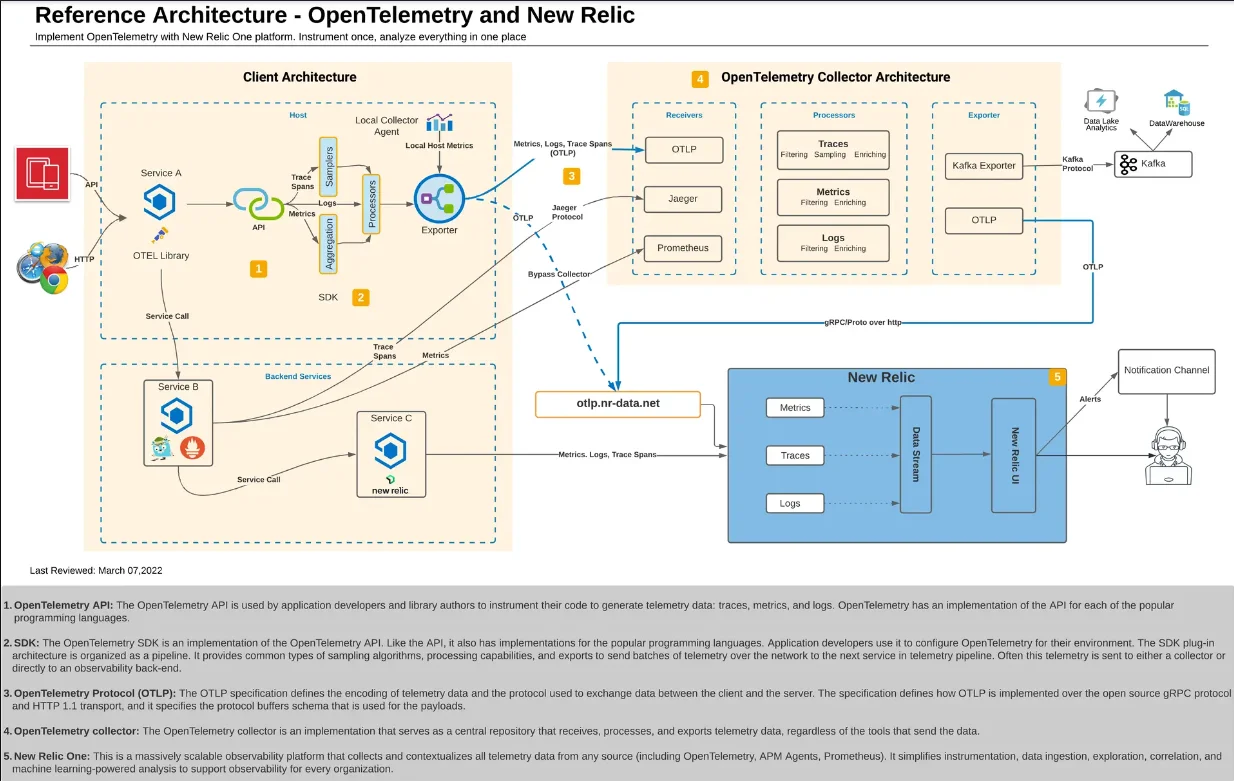
Typically, you start by configuring the Collector with a processor that enhances the APM telemetry by adding extra context through resource attributes before exporting the data to New Relic using OTLP. New Relic then identifies this correlation data and builds relationships between APM and infrastructure entities based on those resources. While the specifics of the configuration can differ depending on requirements, collectors that send data to New Relic should have certain things in common such as
- OTLP Exporter: The OpenTelemetry Collector can export data using the OTLP/HTTP exporter, so it's important to configure it according to New Relic's OTLP requirements.
- Batch Processor: It sets up the Collector to utilise the batch processor for exporting records in batches, provided you adjust the batch size and frequency to comply with New Relic's OTLP requirements.
Visualize OpenTelemetry data alongside New Relic's native telemetry
Once OTEL data is ingested by New Relic, you can view and analyze both OTEL and New Relic's native telemetry concurrently. This feature is particularly useful in environments where deploying New Relic's native agents may not be feasible, such as certain cloud or serverless setups—OpenTelemetry effectively bridges that gap. You still benefit from New Relic's robust platform capabilities, including dashboards, alerts, analytics, and distributed tracing for both data types.
Leverage New Relic's analysis and alerting capabilities on OpenTelemetry data to enhance your observability
By integrating this data with New Relic's powerful analytics, you can gain valuable insights into application performance and reliability. Users can create customized dashboards, set alerts based on specific metrics, and visualize trends, streamlining monitoring and enabling quicker anomaly detection. Additionally, New Relic's machine learning algorithms help proactively identify potential performance issues, ensuring smoother application operation.
Possible Challenges of integrating OpenTelemetry with New Relic
- Mapping between OpenTelemetry and New Relic data models may not be perfect: OTEL serves as an open standard for cross-platform integration, while New Relic's model is tailored for its ecosystem. This can lead to mismatches in interpreting spans, attributes, and resource metadata, resulting in issues like loss of detail, inconsistent tagging, or gaps in telemetry data. Consequently, some nuances may not fully translate, limiting the use of New Relic's advanced analytics and visualization features when the source data comes from OTEL.
- Some advanced New Relic features might require additional configuration: New Relic's agents are specifically designed for smooth integration within its ecosystem. In contrast, OpenTelemetry offers greater flexibility but demands additional effort to set up and manage the data pipeline.
- Performance overhead of running both OpenTelemetry and New Relic agents: Running OpenTelemetry (OTEL) and New Relic agents simultaneously can lead to significant performance overhead due to their similar operational methods. Both agents utilize low-level language hooks through techniques like byte-code manipulation or monkey patching, which can result in conflicts. While they might work side by side, generating telemetry independently, they also risk overriding each other's changes, potentially causing bugs or degraded performance. Thus, it's recommended to use only one APM product at a time to avoid compatibility issues.
Benefits of combining OpenTelemetry with New Relic
- Future Backend Flexibility: OpenTelemetry (OTEL) allows you to send telemetry data to various backends. If you switch from New Relic to another tool like Dynatrace or Prometheus, you won't need to redo instrumentation, as OTEL manages this process while New Relic's agents are tied to its ecosystem.
- Standardized Instrumentation: Integrating OpenTelemetry with New Relic ensures consistent instrumentation across your tech stack, regardless of language or platform. Its open-source framework standardizes traces, metrics, and logs, enhancing maintainability and reducing complexity while leveraging New Relic's analytics.
- Multiple Platform Data Export: OTEL enables simultaneous data export to various observability platforms, preventing vendor lock-in and supporting hybrid environments. This central hub ensures consistent data flow across platforms without requiring re-instrumentation.
New Relic's roadmap includes deeper OpenTelemetry integration, aiming to provide seamless support for the standard while maintaining its value-added features.
When to Choose OpenTelemetry
OpenTelemetry with a suitable backend is ideal when:
Vendor-agnostic instrumentation is crucial: You want the flexibility to switch observability backends without re-instrumenting your code and your organization has a multi-vendor strategy for observability tools.
Multi-cloud or hybrid environments are in use: OpenTelemetry's consistent instrumentation works across different cloud providers and on-premises systems.
Diverse technology stacks are present: OpenTelemetry supports a wide range of programming languages and frameworks, ensuring consistent observability across your entire stack.
Long-term data portability is a concern: OpenTelemetry's standardized data format reduces the risk of vendor lock-in, making it easier to migrate or replicate data in the future.
New Relic is better suited when:
Quick setup and immediate insights are needed: New Relic's auto-instrumentation and pre-configured dashboards provide value quickly, especially for teams with limited observability expertise.
Extensive pre-built dashboards and alerting are required: New Relic offers a wide range of out-of-the-box visualizations and alert conditions, reducing the need for custom configuration.
Advanced AI-powered analytics are important: New Relic's AI capabilities can automatically detect anomalies and provide proactive insights, which is valuable for large-scale systems.
Unified observability platform needs exist: Organizations looking for a single tool to cover APM, infrastructure monitoring, log management, and user experience monitoring may prefer New Relic's all-in-one approach.
Performance and Scalability Comparison
When evaluating OpenTelemetry and New Relic, consider these performance and scalability factors:
| Factors | OpenTelemetry | New Relic |
|---|---|---|
| Data Ingestion and Processing | Highly efficient data collection, but backend performance depends on your chosen storage and analysis tools. | Optimized for high-volume data ingestion with automatic scaling. |
| Query Performance | Query performance varies based on your backend (e.g., Prometheus, Jaeger). | Offers fast query response times, especially for pre-aggregated metrics. |
| Data Retention | Flexible retention policies based on your storage solution. | Tiered retention policies with options for long-term storage. |
| Scalability in Distributed Systems | Designed for large-scale distributed systems with minimal overhead. | Proven scalability for enterprise-grade deployments. |
| Resource Overhead | Generally lightweight, with configurable sampling to reduce overhead. | Low overhead for most applications but may impact performance in resource-constrained environments. |
Cost Considerations: OpenTelemetry vs. New Relic
Understanding the total cost of ownership (TCO) is crucial when choosing between OpenTelemetry and New Relic:
| Cost Considerations | OpenTelemetry | New Relic |
|---|---|---|
| Initial Implementation Costs | It provides lower upfront costs but requires investment in setup and configuration. This often includes the need for skilled developers or DevOps resources to ensure a proper implementation, which can increase initial costs if expertise isn't already available. | Higher initial costs due to licensing but offers faster time-to-value. The pre-built integrations and dashboards can significantly reduce the learning curve, allowing teams to start gaining insights almost immediately, which can offset initial expenditures. |
| Long-term Operational Expenses | Costs primarily relate to infrastructure for data storage and visualization. As usage grows, organizations may need to invest in more robust storage solutions or additional tools for data analysis, which can add to ongoing expenses. | Ongoing licensing fees based on data ingestion and user access. It's essential to project future growth accurately, as scaling can lead to increasing costs; however, the predictable pricing model can help in budgeting. |
| Hidden Costs in Self-managed Deployments | Consider expenses for maintenance, upgrades, and scaling of your observability stack. Organizations should also factor in the potential costs of troubleshooting and the need for additional resources as complexity increases. | Fewer hidden costs due to managed service, but potential for unexpected charges from high data volume. Understanding the pricing tiers and potential spikes in usage is critical to avoid surprises on monthly bills. |
| ROI Analysis | For small organizations, OpenTelemetry may offer better ROI due to lower costs, if in-house expertise is available. These organizations can leverage their technical resources effectively, turning the initial investment into long-term savings. | For Large enterprises, New Relic's comprehensive features and support may justify the higher costs through improved productivity and faster issue resolution. The ability to streamline operations and reduce downtime can lead to significant cost savings over time. |
The Role of SigNoz in the OpenTelemetry Ecosystem
SigNoz emerges as an open-source alternative to New Relic, leveraging OpenTelemetry for data collection.
Key features of SigNoz include:
- Native support for OpenTelemetry data: SigNoz seamlessly integrates with OpenTelemetry, meaning you can collect and analyze telemetry data (logs, traces, and metrics) without needing proprietary agents. Its native OTEL support allows organizations to standardize their observability setup while avoiding vendor lock-in, making it easier to gather data across various services and platforms.
- User-friendly dashboards and visualizations: These customizable visualizations help developers quickly track down performance bottlenecks, application errors, or latency issues, with minimal configuration.
- Trace aggregation and service dependency mapping: This service mapping helps teams understand how different micro services interact and can be crucial in identifying performance issues or pinpointing service failures, making it easier to trace the root cause of complex issues
- Customizable alerts and anomaly detection: Users can set up alerts tailored to their specific application metrics, allowing teams to receive notifications for abnormal behavior or performance degradation in real-time. This flexibility in alerting ensures quick responses to critical issues and integrates smoothly into existing workflows.
SigNoz offers several benefits when used with OpenTelemetry:
- Open-source flexibility with a turnkey solution being one. SigNoz provides the flexibility of open-source software, meaning it can be customized to fit your needs without the limitations imposed by commercial APM tools.
- As SigNoz is open source, it offers a far more cost-effective option compared to expensive proprietary APM tools like New Relic.
- It provided full control over your observability data. This level of data ownership is important for companies that are concerned about privacy, compliance, or simply prefer to manage their telemetry data in-house, rather than relying on external vendors who may store data in different regions or under varying security protocols.
- It has an active community support and provides updates on a regular basis. This approach ensures that SigNoz evolves in line with user needs, while also providing a support network where users can share best practices and get help with implementation challenges.
SigNoz cloud is the easiest way to run SigNoz. Sign up for a free account and get 30 days of unlimited access to all features.
You can also install and self-host SigNoz yourself since it is open-source. With 19,000+ GitHub stars, open-source SigNoz is loved by developers. Find the instructions to self-host SigNoz.
Future Trends: OpenTelemetry and Commercial Observability Tools
The observability landscape continues to evolve, with several trends shaping the future:
- OpenTelemetry Adoption:
- Prediction: Widespread adoption of OpenTelemetry as the de facto standard for instrumentation. As more organizations recognize its advantages, adoption will grow exponentially.
- Impact: This widespread acceptance will facilitate greater interoperability between different observability tools, allowing for seamless integration and data sharing. As a result, organizations will experience reduced vendor lock-in, empowering them to switch tools or use multiple platforms without losing their investment in instrumentation.
- Commercial Tool Adaptation:
- Trend: Commercial tools like New Relic are likely to enhance their integration with OpenTelemetry, providing users with more options for data collection and analysis.
- Outcome: As these tools adopt OpenTelemetry standards, the lines between open-source and commercial observability solutions will blur. Users will benefit from the strengths of both worlds—flexible, customisable open-source options alongside the robust features and support of commercial products.
- Emerging Observability Patterns:
- Focus on eBPF: The rise of extended Berkeley Packet Filter (eBPF) technology is revolutionizing low-overhead instrumentation. eBPF runs custom code within the Linux kernel ("kernel space"), making it faster than traditional "user space" operations. It minimizes resource usage and system crash risks by running in a sandboxed environment. Plus, eBPF allows code execution without changing kernel source code or loading new modules, streamlining OS updates while ensuring efficient data collection with minimal performance impact.
- Real-time, Streaming Analytics: The demand for real-time analytics will grow, enabling organizations to derive insights from their data as it streams in, enhancing decision-making and response times.
- Importance in Edge Computing and IoT: With the rise of edge computing and IoT devices, observability solutions will need to adapt to monitor distributed environments effectively, ensuring visibility across diverse systems and locations.
- AI and Machine Learning in Observability:
- Advanced Anomaly Detection: The integration of AI and machine learning will enable advanced anomaly detection, allowing observability tools to identify unusual patterns and behaviors in real-time, thereby reducing response times to potential issues.
- Automated Root Cause Analysis: AI-driven solutions facilitate automated root cause analysis, providing insights and remediation suggestions based on historical data and machine learning models, streamlining the troubleshooting process.
- AI-assisted Query Building: As the complexity of data grows, AI-assisted query building and data exploration will help users navigate their telemetry data more effectively, making it easier to extract valuable insights without needing deep technical expertise.
Key Takeaways
- OpenTelemetry provides vendor-agnostic instrumentation, while New Relic offers a comprehensive commercial solution.
- Your choice between OpenTelemetry and New Relic depends on specific organizational needs, resources, and long-term strategy.
- Integration of OpenTelemetry with commercial tools like New Relic is becoming increasingly common, offering flexibility and powerful analytics.
- Consider factors such as customization needs, scalability, and total cost of ownership when making your decision.
- Open-source alternatives like SigNoz offer a middle ground, combining OpenTelemetry benefits with ready-to-use platforms.
FAQs
Can OpenTelemetry data be sent to New Relic?
Yes, New Relic supports ingestion of OpenTelemetry data. You can configure your OpenTelemetry collectors to export traces, metrics, and logs to New Relic, allowing you to leverage New Relic's analysis capabilities while maintaining the flexibility of OpenTelemetry instrumentation.
Is OpenTelemetry completely free to use?
While OpenTelemetry itself is free and open source, implementing a complete observability solution with OpenTelemetry involves costs for data storage, visualization tools, and infrastructure. These costs can vary depending on your chosen backend and scale of deployment.
How does New Relic's pricing compare to self-hosted OpenTelemetry solutions?
New Relic's pricing is based on data ingestion and user access, which can lead to higher costs for large-scale deployments. Self-hosted OpenTelemetry solutions may have lower direct costs but require more in-house expertise and infrastructure management. The total cost comparison depends on your specific use case, data volume, and available resources.
What are the main challenges in adopting OpenTelemetry?
Common challenges in OpenTelemetry adoption include:
- Initial setup and configuration complexity
- Choosing and integrating appropriate backend systems
- Ensuring consistent instrumentation across diverse technology stacks
- Managing the performance impact of data collection at scale
- Keeping up with the rapidly evolving OpenTelemetry ecosystem

